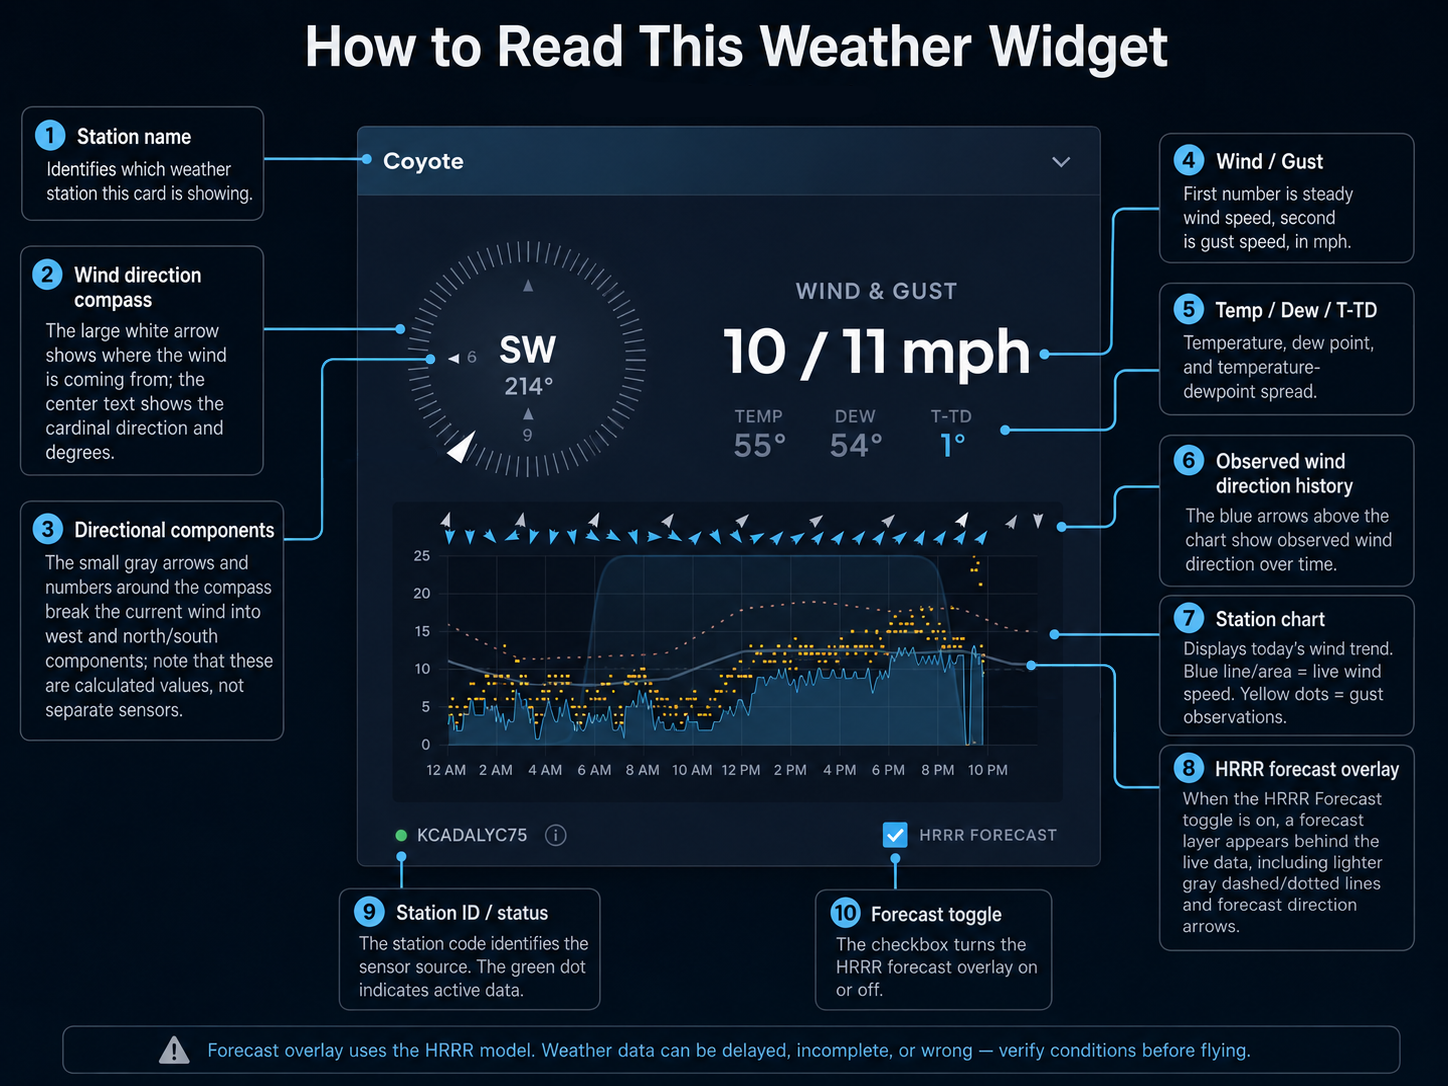
Compass Arrows

Main arrow and side components

The large white arrow is self-explanatory. It simply shows the direction the wind is coming from. The text in the middle shows the matching cardinal direction and degrees.

The small gray arrows and numbers around the edge break the current wind speed into its directional components. The west arrow shows how much of the wind is pushing from the west, and the north or south arrow show how much from the north-south. Those numbers are not separate sensors. They are calculated from the current wind speed and direction.

This information is useful for estimating the risk of being blown back. As the westerly component of the Funston, Coyote, or Mussel Rock meter approaches 20 mph, the danger of blowback increases.

Forecast On The Station Charts

The Forcast toggle

When the Forcast switch is off, which is the default, the station chart shows observations only. When it is on, the chart adds a forecast layer behind the live data.

The lighter gray dashed line is forecast wind speed. The dotted line is forecast gust. A second row of light gray outlined arrows appears above the observed blue arrow row and shows forecast wind direction.

The forecast uses the HRRR model. Mussel Rock and Coyote share the same HRRR forecast point. Fort Funston and Sharp Park each use their own forecast point.

Mussel Rock Forecast Widget

Model forecast view

The larger Mussel Rock Forecast widget defaults to HRRR, which is NOAA's High-Resolution Rapid Refresh model. HRRR is used here because it updates frequently and usually does a better job with short-range coastal wind timing than broader models.

You can also switch that widget to NWS NDFD with the model selector in the header.

Questions

Suggestions welcome.